 Introduction
Introduction
This case study documents an experimental approach of analyzing low resolution Landsat satellite imagery to document and map pixel value change in Aleppo between 2011 and the end of June 2016. Using a method that is typically employed by remote sensing scientists to study ecological change, we have developed an algorithm that is trained on a different geography – urban Aleppo – to ask a different set of questions – how might we remotely sense urban damage that is the result of war?Using nearly two hundred open-access satellite images, we have mapped the spatiality and temporality of changes in pixel values of satellite images over Aleppo, offering a remotely collected record of significant change in Aleppo measured twice a month for the last 64 months. As an experimental method it is rife with ambiguity and flaws, but opens up wide horizons for future work by our research group as well as by journalists and human rights advocates who are seeking new ways to document the memory of destruction in urban war zones.
Previous Approaches
To date, satellite-based assessments of damage in Aleppo have most often come through qualitative, visual interpretation of very high resolution (less than 1 meter) satellite images acquired at two dates of interest. Visible changes in urban features -- a damaged building, a scorched field, or a collapsed bridge, for example -- have been documented by groups including Human Rights Watch (HRW) and the United Nations’ Operational Satellite Applications Programme (UNOSAT). Though HRW’s and UNOSAT’s approaches differ in terms of visual analytical techniques and the selection of image dates, both approaches rely on expensive commercial imagery, are highly localized (i.e., identifying point-locations of damage), and are not automated. Critically, since HRW and UNOSAT assessments often come in response to specific events such as barrel bomb campaigns by the Assad Regime, the passage of significant resolutions by the U.N, or the commencement of the Russian aerial bombing campaign, there is little information captured on the many interstitial and potentially small-scale damages resulting from ongoing bombing campaigns, assaults, and other acts of armed violence throughout the flow of the war.Both UNOSAT and Human Rights Watch have produced multiple georeferenced datasets derived from commercial satellite imagery that capture specific locations of significant damages in Aleppo as well as Kobane, Homs, Damascus and other smaller cities. UNOSAT has released two damage maps of Aleppo over the last five years, drawing on five satellite images. Human Rights Watch has used a similar methodology to gather evidence for their reports. Image pairs used by UNOSAT and HRW for a given damage map have sometimes been taken as few as five days apart and other times as many as over 900 days apart. These damage assessments offer snapshots of conflict-induced urban damage but cannot capture the ebbs and flows of damage to Aleppo over the course of the war.
Landsat satellite imagery spatial, temporal, and spectral characteristics
Rather than relying on commercial imagery, we use open-access satellite imagery collected by two NASA/USGS satellites, Landsat 7 (launched in 1999) and Landsat 8 (launched in 2013). Each satellite has collected imagery over Aleppo every 16 days since the start of the War, and, together, have collected 238 images from March 11, 2011, through July 5, 2016. This density of coverage supports near-continual monitoring of the Civil War unrivaled by any other publicly-accessible dataset.Data from Landsat satellites were never meant to be used to assess the effects of armed conflict on urban infrastructure, and were originally designed for ecological monitoring such as measuring forest health or mapping agricultural expansion. With those applications in mind, Landsat has two different kinds of sensors. The first is a multispectral sensor, with a series of bands (or channels) that are dedicated to measuring different wavelengths of light including near-infrared, red, green, or blue at a resolution of 30 meters on the ground per pixel. The amounts of light reflected by an object on the ground, and changes in the amount of light reflected by an object on the ground -- an apartment building, a street intersection, or a cluster of trees in a city park -- can reveal information about that object or its changes. For example, since healthy vegetation reflects an abundance of the sun’s near-infrared light but very little red light, comparing the amount of reflected near-infrared light to red light is a commonly used method for identifying healthy trees.
Landsat 7 and 8 have another sensor that makes images that are read similarly to black-and-white photographs. The panchromatic sensor has a single band that collects visible light reflected off the Earth’s surface; dark features appear dark, light features appear light. Since the panchromatic sensor’s single band collects light that would have been split up across several multispectral bands, pixels in panchromatic imagery can have a finer resolution than pixels in Landsat multispectral imagery, capturing 15 meters on the ground in each pixel. This means that panchromatic imagery give a much more detailed perspective on the spatial distribution of changes in Aleppo than what could be seen with multispectral data.
The tone of each pixel in a panchromatic image is depicted by an 8-bit number; a perfectly dark pixel has a value of 0, a completely bright pixel is given the value of 255, and most features in Aleppo have values between 30 and 100. A pixel centered on a paved road, for example, may have a panchromatic value of 62 and a bright concrete roof of may have a value of 94. Vegetation like trees or gardens and exposed soil tend to appear as moderately dark with a panchromatic value around 24. Between successive images acquired 16 days apart, and certainly over the course of a year, pixel values change due to shifts in sun position, shadow alignment, atmospheric haze, and activities such as construction, farming, or, in the case of Aleppo, conflict-induced damage to infrastructure, buildings, or vegetation.
Mapping Pixel Value Change
Since Landsat images were acquired every 16 days throughout the course of the Civil War, clouds and their shadows came and went, obstructing what the satellite could see of Aleppo. Removing clouds and shadow is the first task in preparing Landsat images for analysis.
USGS provides maps of cloudy pixels in every Landsat image by finding pixels that are both very bright and relatively cold, and shadows cast by clouds based on cloud location and the sun’s illumination angle. With these maps, we readily removed clouds and shadows from each image, and remaining cloud- and shadow-free pixels were considered in the change assessment.
For each pair of images acquired 16 days apart, we recorded differences in pixel values across Aleppo. Changes in the brightness of all infrastructures, such as roadways, runways, and bridges, vegetation, and buildings were mapped for each change pair. Buildings that experienced damage were often darker afterwards, and this shift is represented by a decline in panchromatic values. Sites of destroyed trees, on the other hand, often appeared brighter due to the removal of the dark tree canopy and exposure of the lighter ground underneath.
Across all 238 images, the majority of Aleppo appears ‘stable’ from one image to the next and most of the pixel-level changes are very low. Few pixels show significant changes between images but very large changes may indicate a bombed building or an intersection that has been covered in debris. In order to monitor the spatial and temporal diffusion of damages across Aleppo, only changes greater than a specific threshold were considered ‘significant’. By setting this threshold we have decided to ignore the ‘background’ changes which are likely caused by other factors.
Since we used a series of satellite images collected only 16 days apart, we can identify discrete damage events over the course of the war. For example, we can map damages at and surrounding Aleppo’s hospitals that have been repeatedly bombed or track the war’s impacts on the historic citadel. We can also visualize smaller-scale or relatively ephemeral changes that would go unnoticed in punctuated change assessments from UNOSAT or HRW. Of special interest, the city’s roadways and intersections that have been critical to transporting goods and aid into and through the city also show regular changes over the course of the war; most of these changes go unmapped in the necessarily focused damage maps produced by UNOSAT and HRW.
For example, Castello Road in the northern part of the city served as a key access route to the rebel-held eastern portions of the city throughout the war. During May and June 2016 this road was deliberately targeted. This is documented extensively with YouTube videos and also is made visible through the Landsat analysis.
Landsat Image of Castello road on May 25, 2016
Landsat Image of Castello road on June 10, 2016 with areas of 'significant' pixel value change highlighted.
Significant Landsat pixel value changes overlaid on March 2016 high resolution satellite imagery.
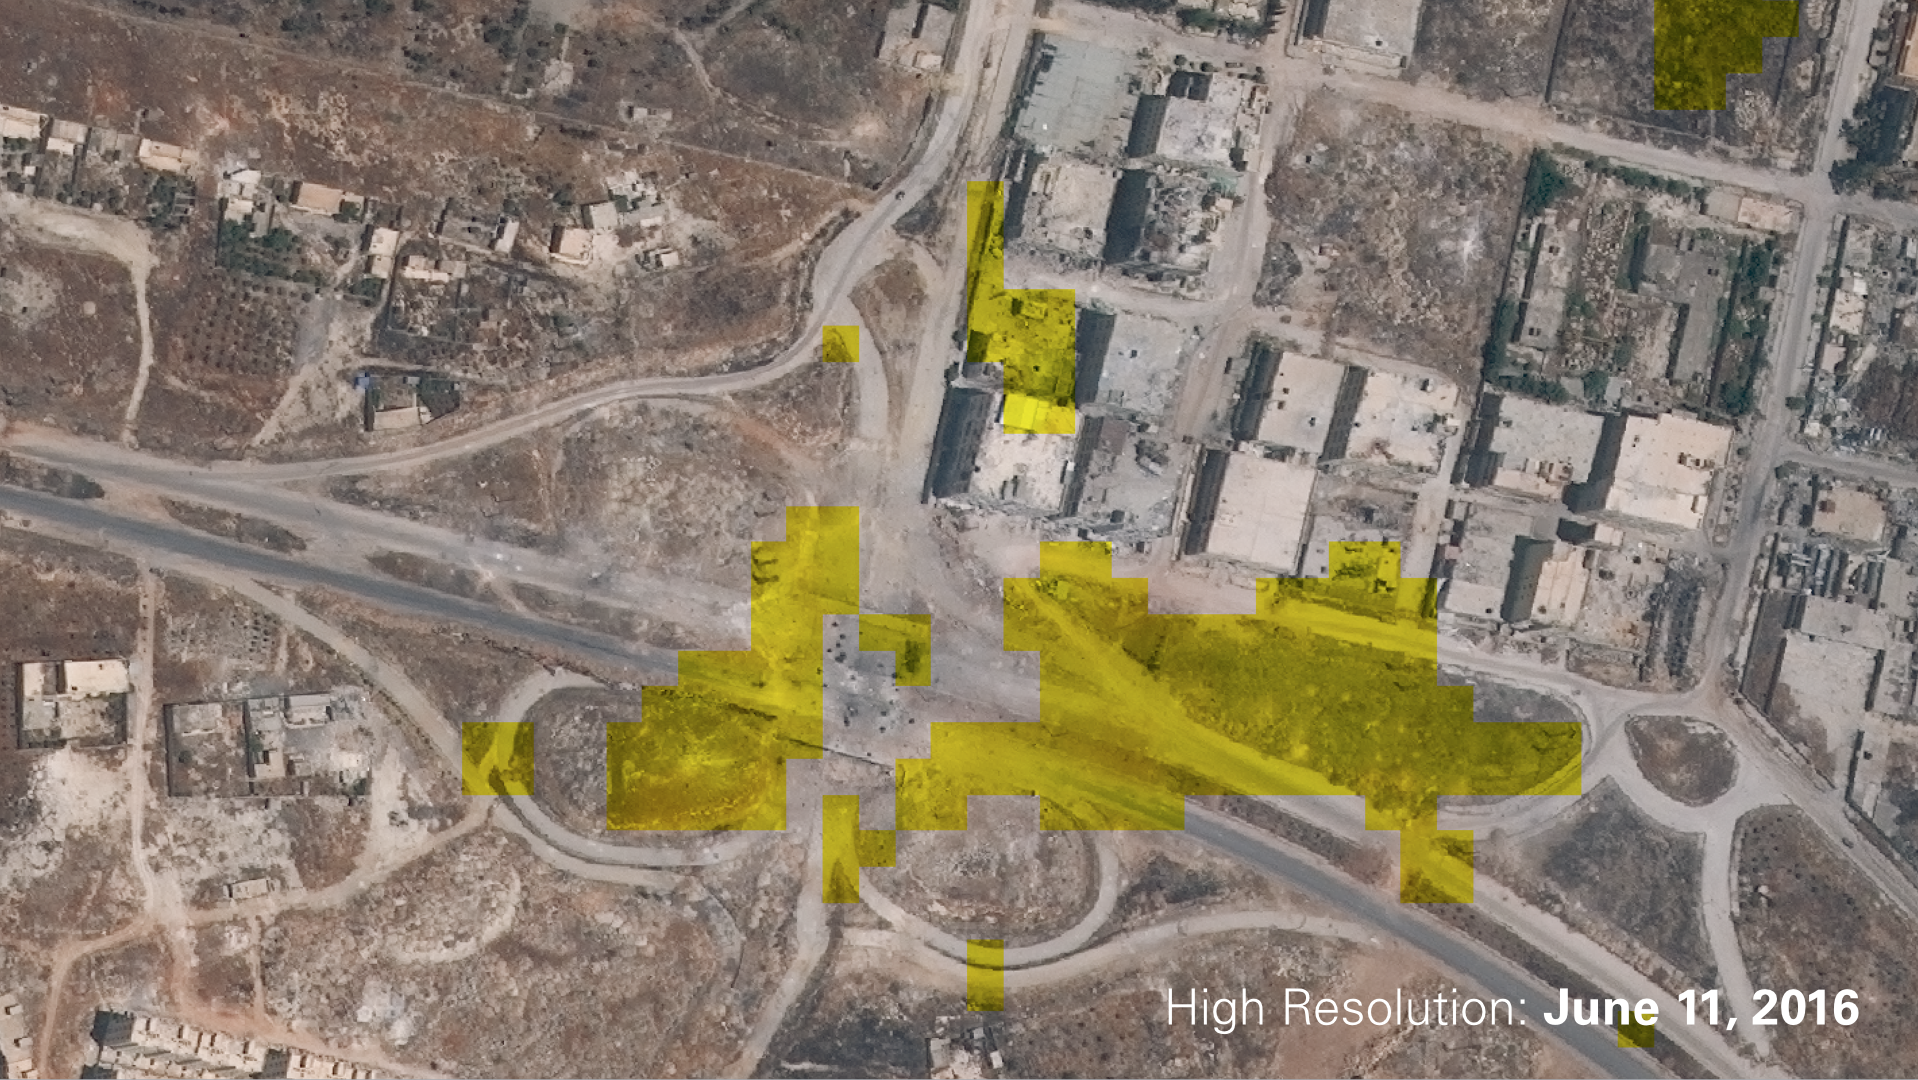
High resolution satellite image from June 11, 2016 (one day after the second Landsat image was taken) which show major damage to Castello Road overpass as well as buildings in the surrounding area.
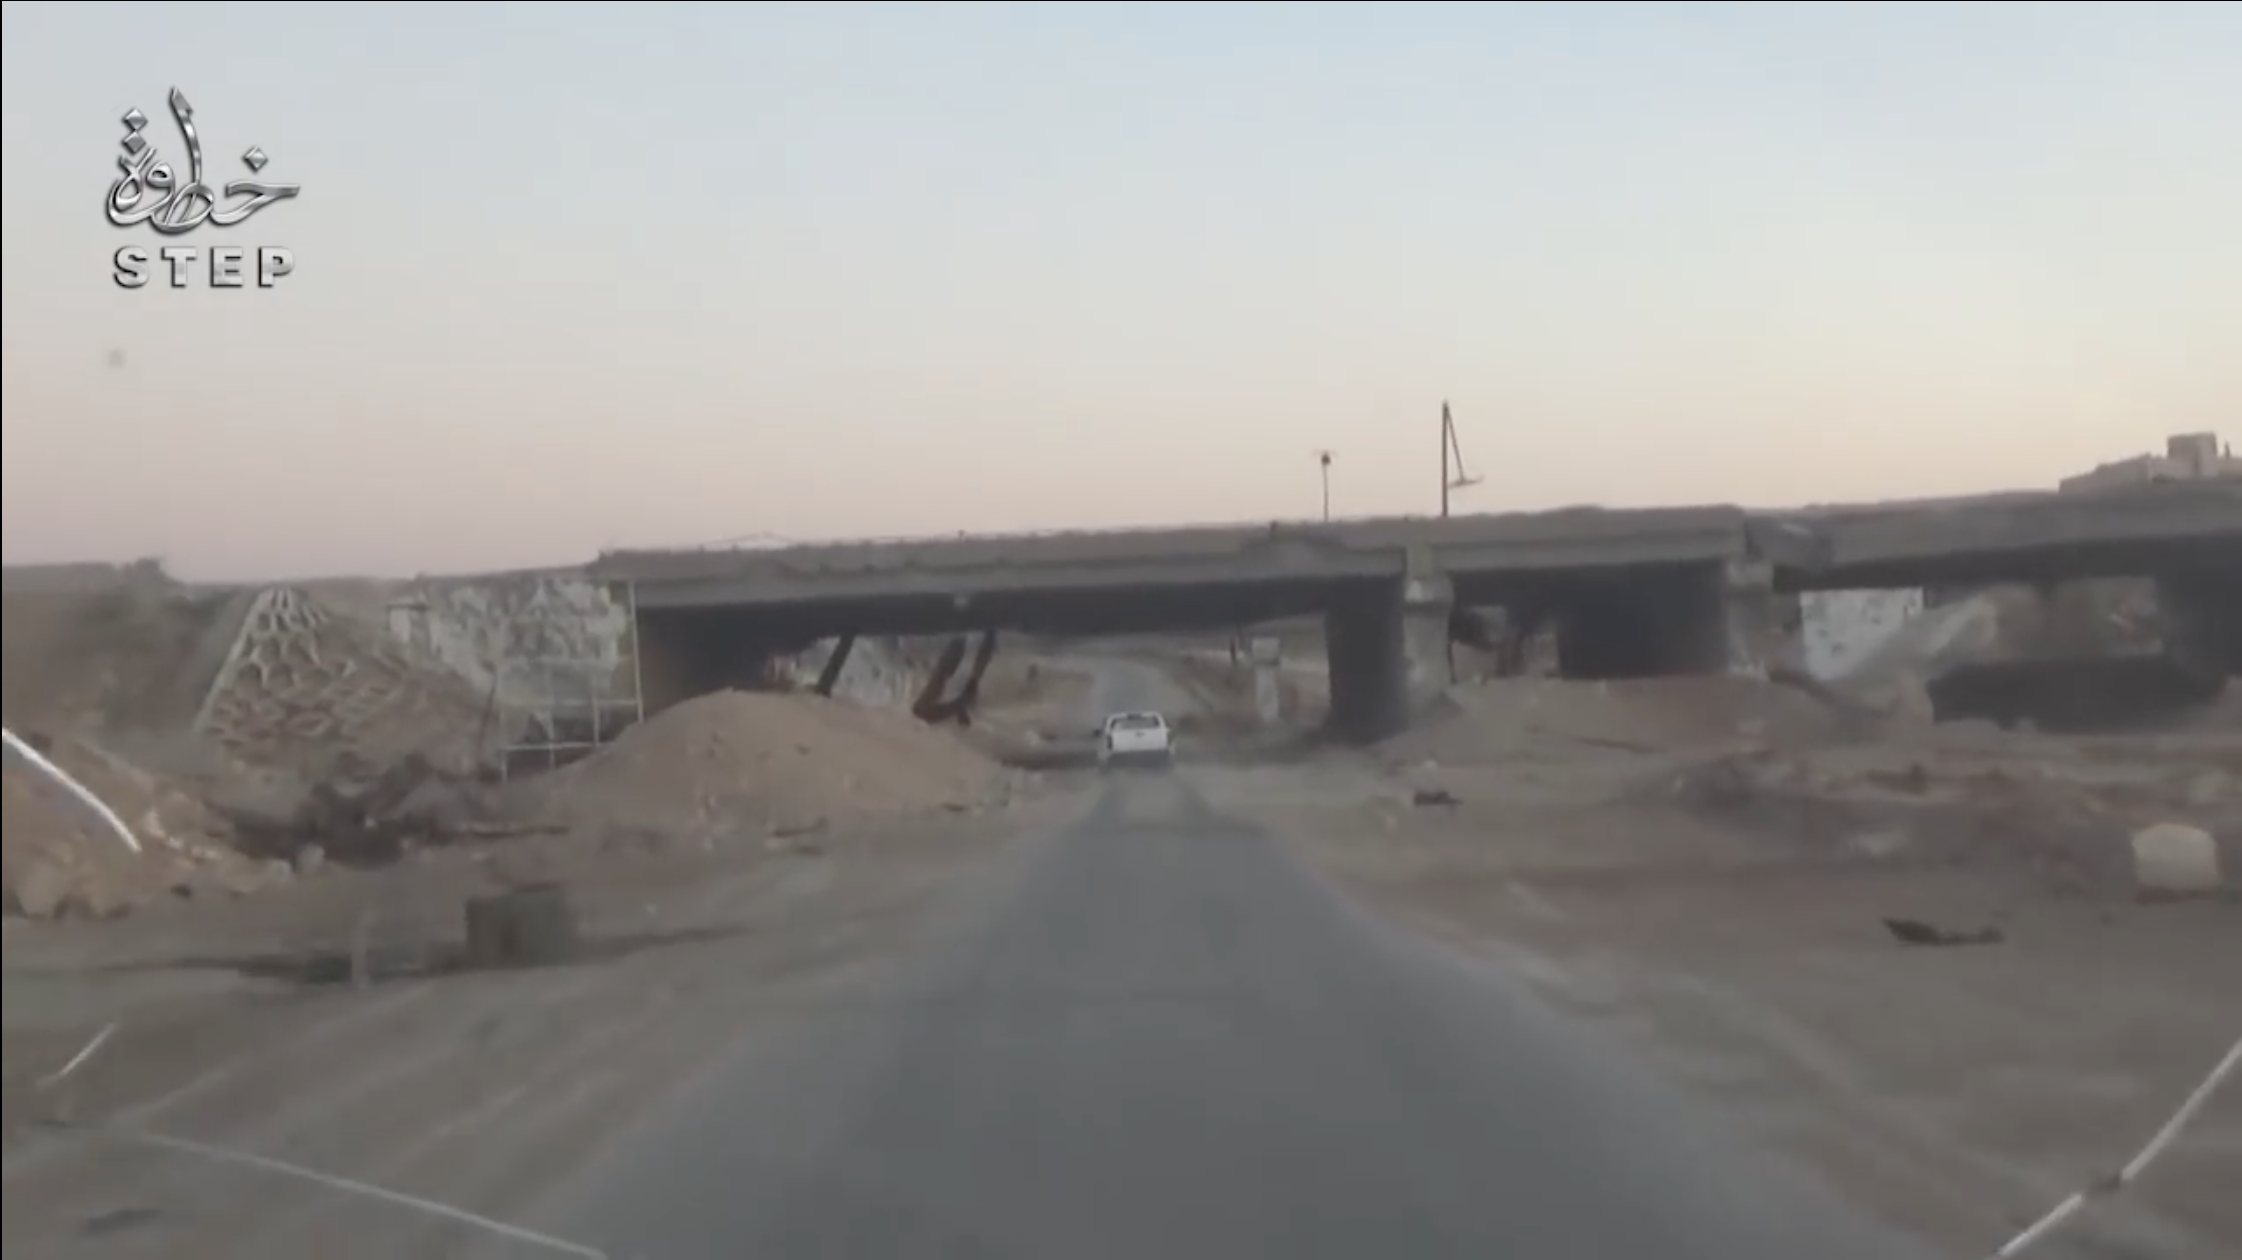
YouTube video filmed from a car driving west along Castello road that confirms the visible damage to this overpass and surrounding areas, starting at minute 1:01.
Case Study Team:
Jamon Van Den Hoek, Grga Basic, Laura Kurgan, Dare Brawley
Return to Case Studies