 The Data Layers
The Data Layers
The interactive maps that form a core component of the Conflict Urbanism: Aleppo project bring together diverse data sets -- high-resolution satellite images, neighborhood boundaries, locations of damaged buildings identified by the UN, geolocated youtube videos -- that each present unique representations of the city of Aleppo. Using the logic of a typical geographic information system (GIS) map, the Conflict Urbanism: Aleppo project overlaps these layers, accruing two kinds of evidence: evidence about the physical destruction of the city over the last five year and evidence about how urban warfare is tracked and monitored from a distance.The following sections describe the data we have used in our project, the ways each layer obscures as much as it reveals, and how we have used each layer to analyze urban damage in Aleppo.
The High Resolution Satellite View
Although we tend to take it for granted today, the high-resolution satellite technology and imagery that we make use of here was only declassified and made generally available a decade and a half ago. Although these satellites orbit the globe regularly, their sensors need to be tasked, such that image-data about a particular point on the globe can be captured. Once the image has been retrieved and delivered to its first user, it becomes available for purchase by others as well.
Our work intentionally interrogates the potential use of these ubiquitous satellite images. Although it may seem unusual to use a formerly-military technology to investigate the effects of armed conflict, we are interested in exploring what it means to use these techniques for very different ends.
1
What kinds of knowledge about cities and regions in conflict can be gathered by looking carefully at date-and-time-stamped high resolution satellite imagery? How are these images used by humanitarian organizations and the United Nations to study conflict zones? What kinds of urban scale phenomena are invisible on satellite images?
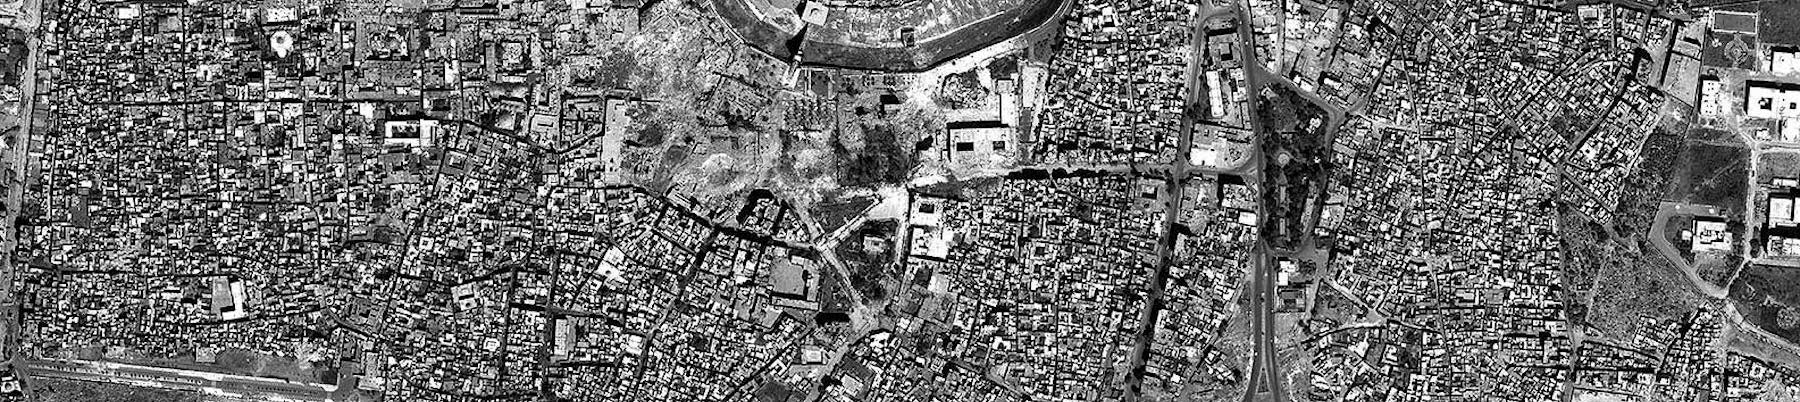
Our platform customizes an open-source Google-Earth-like interface, Mapbox, to display views of Aleppo. We have used three high-resolution satellite images from different points in the conflict – May 1, 2012, August 10, 2014 and September 3, 2015, and March 23, 2016.
With them urban damage in Aleppo becomes visible over time at 50cm per pixel resolution, the highest resolution available to civilian users until very recently. These images serve as a base map and a point of reference for the data layers on the platform.
Neighborhoods of Aleppo
We have created a map of the neighborhoods of Aleppo, which serves as a key navigational tool on the platform. We based our listing of neighborhoods on one developed by the UN Habitat program in 2013, and then used Wikimapia,
2
Google Maps, and UNOSAT for additional verification and to disambiguate neighborhood boundaries and common names. The ability to navigate the city by neighborhood allows researchers to contextualize damage in the urban fabric of Aleppo, and to correlate specific events in the conflict with socio-demographic information about the city from other sources, as well as with information from social media and elsewhere.
Open Street Map
Open Street Map is web-based platform, through which volunteers from across the globe have produced a digital, crowd sourced world map, distributed under an open source license. Although many parts of the world are well mapped down to the scale of individual buildings; significant cities, regions and countries are not yet fully mapped. Parts of Aleppo are among these unmapped, or under-mapped, areas. An advantage of Open Street Map, is that a map can be presented in many styles to emphasize different attributes of a place: for Aleppo we have adapted a figure ground map-type, based on a style developed by Stamen Design, to emphasize where mapped buildings and roads appear as figures against the ground of urban space. This makes especially clear which areas of the city have been more comprehensively mapped versus those which have not. The building footprints and small tributary roads that are clearly visible on satellite imagery are still missing from the map in the eastern and southern areas of the city. When aligned with other data layers on our platform a pattern emerges to show that the geographies of the unmapped areas of Aleppo align with the areas of the city that have seen the most damage during the war. We are doing further research to uncover the demographic, political and environment logic of this hypothesis, neighborhood by neighborhood.
UNITAR - UNOSAT Urban Damage
We have visualized the latest release of their data, which documents all damage recorded on satellite images from November 21, 2010, September 23, 2013, May 23, 2014, April 26, 2015, and May 1, 2015. UNOSAT has recorded a total of 14,034 damaged structures over this time period, including 2,878 that were fully destroyed.
3
UNOSAT is expected to release a new damage assessment sometime in September 2016.The UN uses this information to monitor the state of conflict, in order to facilitate humanitarian operations, to assess compliance with Security Council resolutions, and to document potential violations of international humanitarian law and the Geneva Conventions. Users of this website can use UNOSAT data as a prompt to study the history of a particular destroyed building, the demographics and urbanization patters of particular neighborhoods in Aleppo, or road access and blockages to the city.
UNOSAT's dataset is open to all and has been released in multiple formats. The visualizations we have produced here allow users to examine Aleppo's urban fabric down to the scale of individual buildings and study the effects of the conflict over an extended period of time.
Informal Neighborhoods
This layer was digitized by CSR researchers from a 2009 report entitled “Informal Settlements in Aleppo” that formed one component of the larger “Aleppo City Development Strategy”. This research and master planning project was led by GIZ Deutsche Gesellschaft für Internationale Zusammenarbeit, or German Corporation for International Cooperation) and commissioned by the Syrian government.
4
There is a great deal to be investigated in these reports, beginning with the reasons for their creation: What was the political rationale for designating particular areas of Aleppo as ‘informal’? What are the criteria that were used to determine which areas are considered ‘informal’? Investigating these reports, the data resulted from them, and the motivations behind their creation is urgently important, because these documents will likely form the basis for urban policies and development when Aleppo is eventually rebuilt.
Here users can compare GIZ’s map of ‘informal’ neighborhoods to high resolution satellite images, as well as patterns of damage recorded by UNOSAT.
Spatializing YouTube
YouTube has emerged a key source of information about the conditions of the war in Syria over the course of the conflict -- indeed the conflict has been termed the ‘YouTube War’
5
. These videos, often filmed by non-expert civilians have provided on the ground views from a distance. Many YouTube channels have emerged that have consistently created and uploaded films for the duration of the war, some have posted between one and four thousand videos over the course of the war. Several of these channels have been repeatedly cited by international news media and by human rights organizations, and appear again and again as the key source of evidence of both heinous events and daily life in Syria.YouTube’s central role in the information landscape of the war raises a number of questions: how can human rights organizations and journalists verify the content of these sources? What are the biases of the groups organizing these channels? What patterns emerge in the locations covered by the local journalists and civilians?
The first step in evaluating these questions is to examine the archive of war that has been published through YouTube. We have exploited the naming conventions used by these prominent channels in order to create a map that geolocates videos to the neighborhood that they depict and allows users to search videos by date. Though the videos depict actions in space, they are not tagged with any geographical information about where they have occurred
6
We have created a spatial dataset through YouTube.
Project Team:
Laura Kurgan, Madeeha Merchant, Dare Brawley, Grga Basic
Return to Case Studies